

Major Sea Freight Routes from China to USA and Port Infrastructure
Key Maritime Corridors Across the Pacific Ocean
The primary shipping lanes connecting China to the U.S. traverse the North Pacific Ocean, with three dominant routes:
- Trans-Pacific Route: Connects Shanghai and Shenzhen to Los Angeles/Long Beach (15–18 days transit)
- Great Circle Route: Links Ningbo to Seattle/Tacoma (19–23 days transit)
- Southern Route: Services Guangzhou to Oakland via the South China Sea (21–25 days transit)
These corridors handle over 65% of Asia-US maritime trade (World Shipping Council 2023), with vessel operators optimizing fuel efficiency using weather-routing algorithms.
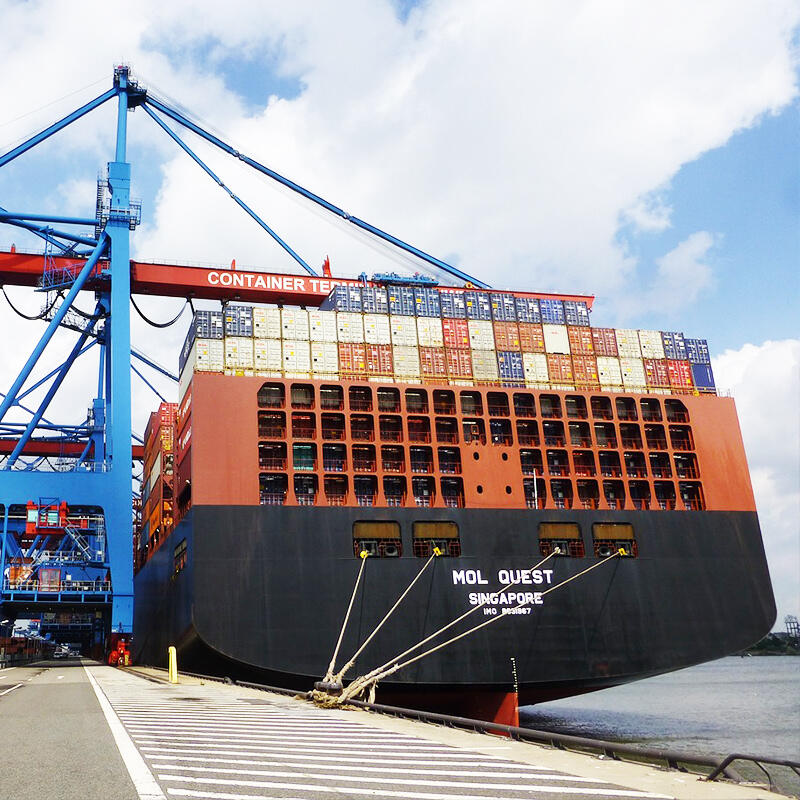
Primary Chinese Ports of Departure: Shanghai, Shenzhen, and Ningbo
China’s container export dominance stems from its coastal megaports:
| Port | 2023 Throughput (TEUs) | Key US Connections |
|---|---|---|
| Shanghai | 47.3 million | LA/Long Beach (32%) |
| Shenzhen | 28.4 million | Oakland (41%) |
| Ningbo-Zhoushan | 33.5 million | Seattle/Tacoma (27%) |
Shanghai alone processes 17% of China-US sea freight, supported by automated yard operations that maintain 98% schedule adherence for ultra-large container vessels.
Main US West Coast Ports: Los Angeles/Long Beach, Seattle, and Oakland
The US West Coast triad handles 54% of Chinese imports via sea freight:
- Los Angeles/Long Beach: Combined 18.8 million TEUs in 2023
- Seattle/Tacoma: 3.4 million TEUs, specializing in refrigerated cargo
- Oakland: 2.6 million TEUs, primary gateway for Northern California
Critical infrastructure upgrades include Long Beach’s $1.5 billion Pier B On-Dock Rail Support Facility (completion in 2025) and Seattle’s Harbor Island Terminal modernization to accommodate 18,000 TEU vessels.
Port Congestion Challenges and Their Impact on Transit Reliability
According to Marine Exchange of LA data from 2023, ships waiting to dock along the West Coast faced average delays of around 7.2 days last year. A combination of factors contributed to this problem. First, there was a noticeable shortage of workers at the docks, with about 12% of positions sitting empty. Then came the seasonal issue with chassis availability dropping as much as 14% during peak periods. And finally, rail yards were struggling too, with cargo spending roughly 22% more time waiting than they did back in 2022. All these problems added up to something pretty significant for shippers. The cost of getting goods from East China to the West Coast went up nearly 20% compared to what companies were paying before the pandemic hit.
Case Study: Delay Patterns at Los Angeles/Long Beach in 2023
Analysis of 12,000 vessel arrivals at the San Pedro Bay complex revealed:
- Peak Season Delays: August–November accounted for 68% of annual congestion
- Vessel Size Correlation: 20,000+ TEU ships faced 15-day delays, nearly double the 8-day average for smaller vessels
- Supply Chain Domino Effect: Each day of port delay extended final-mile delivery timelines by 3.5 days
This volatility has prompted 31% of importers to adopt dual-port strategies, combining West Coast entries with Gulf or East Coast alternatives.
Air Freight Routes from China to USA: Speed, Hubs, and Efficiency
Primary air cargo routes and connectivity between China and USA
Most of the busy air routes take great circle paths across the North Pacific, connecting manufacturing powerhouses such as Shanghai and Shenzhen to key distribution points throughout the United States. A significant portion, maybe around 60 percent or so, of all cargo moving between Asia and North America passes through three main gateways: Shanghai Pudong International Airport (PVG), Beijing Capital International Airport (PEK), and Chicago O'Hare International Airport (ORD). These connections make it possible for goods to reach North American consumers relatively quickly despite the vast distances involved in trans-Pacific shipping.
Top airports handling China-US express freight: Shanghai Pudong, Beijing Capital, Incheon, and Memphis
Shanghai Pudong stands out as the biggest air cargo hub in all of China, moving around 3.7 million metric tons every year. Memphis International Airport has become synonymous with FedEx operations since it acts as their main global sorting facility. Meanwhile, Incheon International Airport connects many smaller American cities through partnerships with airlines such as Korean Air, making sure goods reach places that might otherwise be overlooked. Then there's Beijing Capital which focuses heavily on transporting expensive electronic goods directly from Asia to various spots across the United States including New York, Chicago, and Los Angeles among others. These airports each play unique roles in keeping international trade flowing smoothly despite logistical challenges.
Transit times for air vs. sea freight under standard conditions
Air freight reduces delivery windows to 3–8 days—offering an 85% speed advantage over sea freight’s 25–35 day transit. For example:
| Metric | Air Freight | Sea Freight |
|---|---|---|
| Shanghai to Los Angeles | 2–4 days | 18–22 days |
| Shenzhen to New York | 5–8 days | 32–38 days |
This speed comes at a premium, with air cargo costing 4–6× more per kilogram than ocean shipping.
When to choose air freight for time-sensitive imports
Air transport is optimal for:
- Perishables requiring delivery within 10 days (e.g., seafood, pharmaceuticals)
- High-value goods exceeding $100/kg where inventory carrying costs outweigh freight expenses
- Emergency replenishments during port congestion, which affected 22% of sea shipments in 2023
Many manufacturers and retailers now use hybrid models—shipping bulk inventory by sea and relying on air freight for restocking during peak demand.
Transit Times and Reliability Across Key Shipping Routes
Average Ocean Freight Transit Times: West Coast vs East Coast Destinations
The West Coast ports like LA and Long Beach provide the fastest sea route from China, taking around 18 to 24 days because ships can go straight across the Pacific without detours. For East Coast locations that need to pass through the Panama Canal, shipping takes much longer at about 30 to 35 days. According to numbers from 2023, there's been a pretty big jump in delays too, actually 22% more than what was seen before the pandemic hit. Weather patterns changing with seasons plus staffing issues at ports cause some variation in arrival times, usually around plus or minus five days difference. Because of all this uncertainty, businesses that ship goods where timing matters most tend to favor those West Coast entry points instead.
Trans-Pacific Route Efficiency Benchmarks and Delays
Only 68% of shipments met scheduled arrival times in 2023, according to shipping performance metrics. The Shanghai-Los Angeles corridor maintains an 85% on-time arrival rate outside peak seasons, but this drops to 52% during Q4 holiday surges. Vessel-sharing alliances have reduced blank sailings by 18% year-over-year, enhancing route predictability.
Impact of Global Bottlenecks and Canal Availability on Routing
The 2023 Panama Canal drought forced 14% of Asia-East Coast traffic to reroute via the Suez Canal, adding 7–10 days to transit times. As shown in maritime logistics studies, congestion at key chokepoints increases average shipping costs by $2,800/FEU. Canal slot auctions now represent 12–15% of total freight costs on impacted routes.
Strategies to Mitigate Transit Disruptions and Improve Predictability
Leading importers use real-time container tracking and multi-port diversification to reduce delay risks by up to 40%. Buffer inventory hubs near Savannah and Houston expanded by 31% in 2023 as companies adopted “Port+1” contingency plans. Advanced weather routing systems now prevent 19% of potential typhoon-related delays.
Cost, Time, and Risk Trade-offs in Route Selection for Importers
Balancing Cost, Speed, and Reliability in Shipping Decisions
When choosing between shipping options from China to the United States, importers face tough choices between different factors. Going with ocean freight saves anywhere from 60 to 85 percent on costs compared to flying cargo across, but it takes significantly longer - around 15 to 35 days for delivery. Air shipping gets products there three to five times quicker, which makes sense for expensive merchandise or things that need immediate attention. However, this speed comes at a price point that works best only for certain types of goods. The reliability factor adds another layer of complexity to these decisions. Last year during the fourth quarter, problems at West Coast ports held back nearly one third of all incoming shipments, delaying them anywhere from seven to fourteen extra days. This kind of delay really eats into any cost benefits especially when dealing with fresh produce or items tied to specific seasons.
Economic Implications of Overreliance on West Coast Ports
Putting all cargo through Los Angeles and Long Beach ports, which handle around 40% of goods moving between Asia and the US, creates major problems for companies. When there was talk of strikes back in 2023, it looked like $2 billion worth of stuff moving each day could get stuck somewhere else entirely. That situation really showed just how fragile our system is. Many businesses are now looking at spreading out their shipments. Moving about 15 to 20% of cargo to Gulf Coast or East Coast ports adds 3 to 5 extra days to delivery times, but this strategy helps avoid getting trapped in those West Coast bottlenecks. Plus, companies that diversify like this often see their insurance costs drop between 8 and 12 percent because insurers view them as lower risk overall.
How Supply Chain Disruptions Influence Key Shipping Routes
Events like the 2023 Panama Canal drought caused 9% of Asia-East Coast traffic to reroute via Suez or land bridges, increasing container costs by $1,500–$2,800. Such disruptions have led 62% of importers to implement multi-route contingency plans, pairing air charter services for critical components with ocean freight for standard inventory.
Emerging Trends: Nearshoring and Inland Distribution Hub Diversification
Manufacturers looking to cut back on their reliance on shipping from China are moving around 30 to 45 percent of their component manufacturing operations to Mexico or Central America these days. This shift makes sense because companies can take advantage of the CAFTA-DR trade agreements and also shorten those lengthy supply chains that have become so problematic. Meanwhile we're seeing something interesting happening with inland logistics centers too. Places like Chicago and Dallas are expanding pretty fast actually, about 18 percent each year according to recent data. Import businesses are finding ways around the constant bottlenecks at coastal ports by using transloaded LCL shipments instead. And this approach seems to be working well since it cuts down those final delivery costs somewhere between 12 and maybe even 20 percent in some cases.
FAQ
What are the major sea freight routes from China to the USA?
The major sea freight routes are the Trans-Pacific Route, the Great Circle Route, and the Southern Route connecting various Chinese ports to key US ports.
What factors affect shipping schedules from China to the USA?
Factors include worker shortages, infrastructure issues, seasonal changes, weather conditions, and congestion at ports.
How do air freight and sea freight compare in terms of speed?
Air freight is significantly faster, offering delivery in 3–8 days compared to 25–35 days for sea freight.
When should importers choose air freight over sea freight?
Air freight is optimal for perishable goods, high-value items, and in emergencies where sea freight is delayed.
Table of Contents
-
Major Sea Freight Routes from China to USA and Port Infrastructure
- Key Maritime Corridors Across the Pacific Ocean
- Primary Chinese Ports of Departure: Shanghai, Shenzhen, and Ningbo
- Main US West Coast Ports: Los Angeles/Long Beach, Seattle, and Oakland
- Port Congestion Challenges and Their Impact on Transit Reliability
- Case Study: Delay Patterns at Los Angeles/Long Beach in 2023
-
Air Freight Routes from China to USA: Speed, Hubs, and Efficiency
- Primary air cargo routes and connectivity between China and USA
- Top airports handling China-US express freight: Shanghai Pudong, Beijing Capital, Incheon, and Memphis
- Transit times for air vs. sea freight under standard conditions
- When to choose air freight for time-sensitive imports
- Transit Times and Reliability Across Key Shipping Routes
- Cost, Time, and Risk Trade-offs in Route Selection for Importers